Bug 1673058
| Summary: | Network throughput usage increased x5 | ||||||
|---|---|---|---|---|---|---|---|
| Product: | [Community] GlusterFS | Reporter: | Jacob <jsecchiero> | ||||
| Component: | core | Assignee: | Poornima G <pgurusid> | ||||
| Status: | CLOSED CURRENTRELEASE | QA Contact: | |||||
| Severity: | high | Docs Contact: | |||||
| Priority: | high | ||||||
| Version: | 5 | CC: | amukherj, bengoa, bugs, info, jsecchiero, kompastver, nbalacha, nchilaka, pasik, pgurusid, renaud.fortier, revirii, rob.dewit, sankarshan, vpvainio | ||||
| Target Milestone: | --- | ||||||
| Target Release: | --- | ||||||
| Hardware: | x86_64 | ||||||
| OS: | Linux | ||||||
| Whiteboard: | |||||||
| Fixed In Version: | glusterfs-5.6 | Doc Type: | If docs needed, set a value | ||||
| Doc Text: | Story Points: | --- | |||||
| Clone Of: | |||||||
| : | 1692093 1692101 (view as bug list) | Environment: | |||||
| Last Closed: | 2019-04-08 14:15:01 UTC | Type: | Bug | ||||
| Regression: | --- | Mount Type: | --- | ||||
| Documentation: | --- | CRM: | |||||
| Verified Versions: | Category: | --- | |||||
| oVirt Team: | --- | RHEL 7.3 requirements from Atomic Host: | |||||
| Cloudforms Team: | --- | Target Upstream Version: | |||||
| Embargoed: | |||||||
| Bug Depends On: | |||||||
| Bug Blocks: | 1677319, 1692093, 1692101, 1693935 | ||||||
| Attachments: |
|
||||||
|
Description
Jacob
2019-02-06 15:22:09 UTC
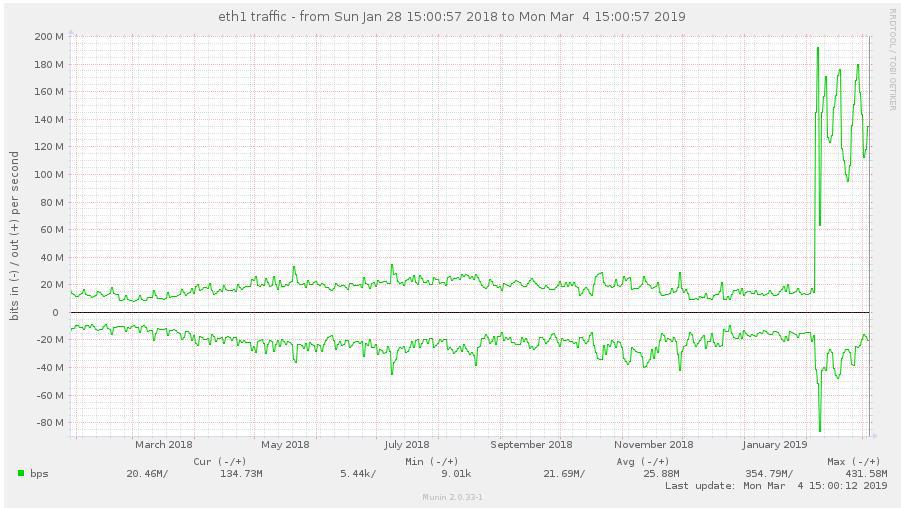
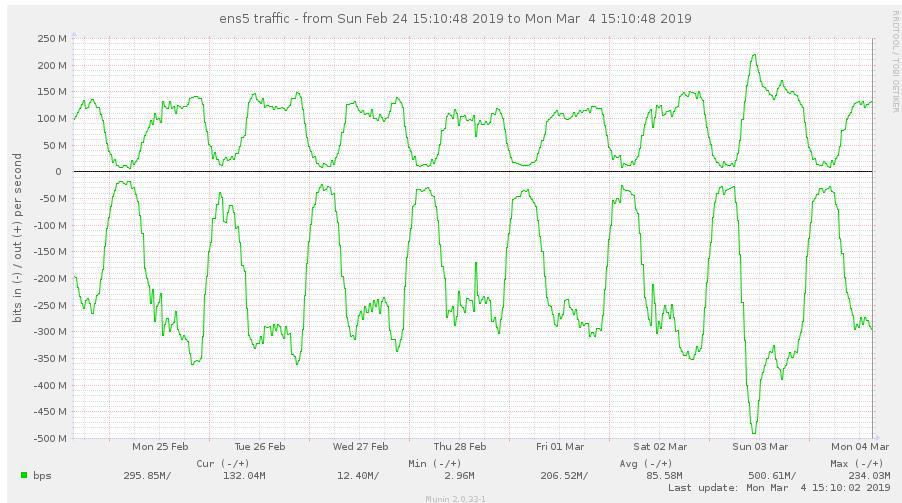
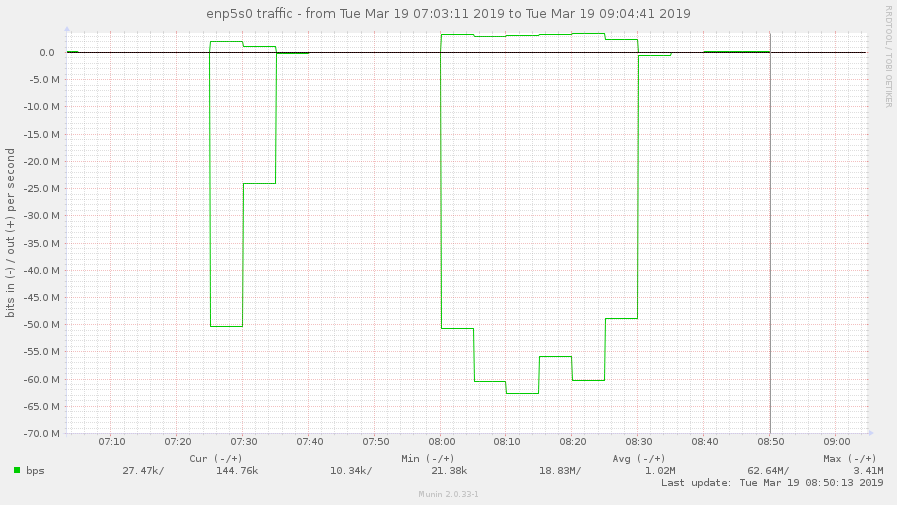
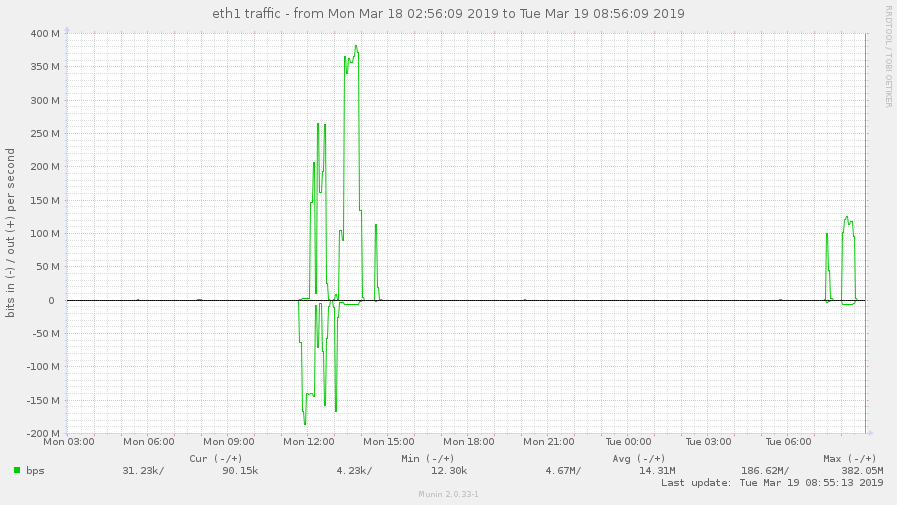
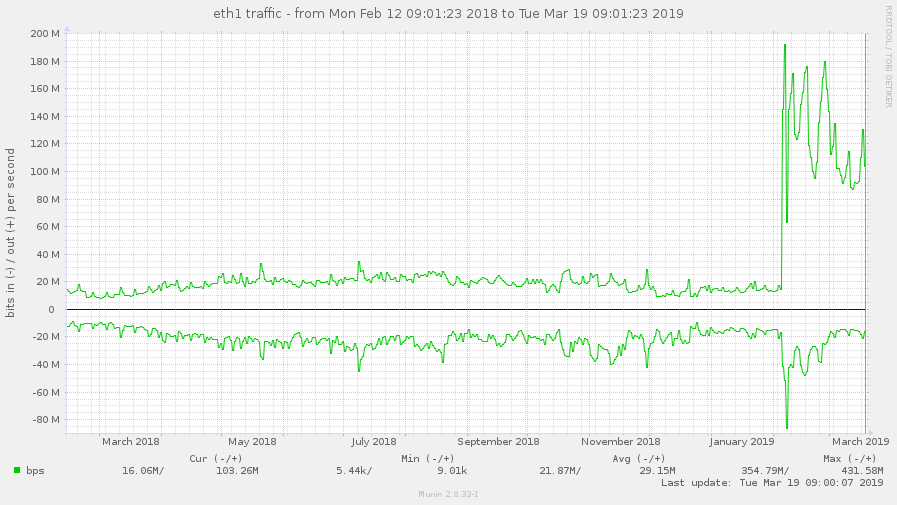
Is this high throughput consistent? Please provide a tcpdump of the client process for about 30s to 1 min during the high throughput to see what packets gluster is sending: In a terminal to the client machine: tcpdump -i any -s 0 -w /var/tmp/dirls.pcap tcp and not port 22 Wait for 30s-1min and stop the capture. Send us the pcap file. Another user reported that turning off readdir-ahead worked for him. Please try that after capturing the statedump and see if it helps you. (In reply to Nithya Balachandran from comment #1) > Is this high throughput consistent? > Please provide a tcpdump of the client process for about 30s to 1 min during > the high throughput to see what packets gluster is sending: > > In a terminal to the client machine: > tcpdump -i any -s 0 -w /var/tmp/dirls.pcap tcp and not port 22 > > Wait for 30s-1min and stop the capture. Send us the pcap file. > > Another user reported that turning off readdir-ahead worked for him. Please > try that after capturing the statedump and see if it helps you. I'm the another user and I can confirm the same behaviour here. On our tests we did: - Mounted the new cluster servers (running 5.3 version) using client 5.3 - Started a find . -type d on a directory with lots of directories. - It generated an outgoing traffic (on the client) of around 90mbps (so, inbound traffic on gluster server). We repeated the same test using 3.8 client (on 5.3 cluster) and the outgoing traffic on the client was just around 1.3 mbps. I can provide pcaps if needed. Cheers, Alberto Bengoa Assigning this to Amar to be reassigned appropriately. i'm not able to upload in the bugzilla portal due to the size of the pcap. You can download from here: https://mega.nz/#!FNY3CS6A!70RpciIzDgNWGwbvEwH-_b88t9e1QVOXyLoN09CG418 Disabling readdir-ahead fixed the issue? We seem to have the same problem with a fresh install of glusterfs 5.3 on a debian stretch. We migrated from an existing setup (version 4.1.6, distribute-replicate) to a new setup (version 5.3, replicate), and traffic on clients went up significantly, maybe causing massive iowait on the clients during high-traffic times. Here are some munin graphs: network traffic on high iowait client: https://abload.de/img/client-eth1-traffic76j4i.jpg network traffic on old servers: https://abload.de/img/oldservers-eth1nejzt.jpg network traffic on new servers: https://abload.de/img/newservers-eth17ojkf.jpg performance.readdir-ahead is on by default. I could deactivate it tomorrow morning (07:00 CEST), and provide tcpdump data if necessary. Regards, Hubert i set performance.readdir-ahead to off and watched network traffic for about 2 hours now, but traffic is still as high. 5-8 times higher than it was with old 4.1.x volumes. just curious: i see hundreds of thousands of these messages: [2019-03-05 12:02:38.423299] W [dict.c:761:dict_ref] (-->/usr/lib/x86_64-linux-gnu/glusterfs/5.3/xlator/performance/quick-read.so(+0x6df4) [0x7f0db452edf4] -->/usr/lib/x86_64-linux-gnu/glusterfs/5.3/xlator/performance/io-cache.so(+0xa39d) [0x7f0db474039d] -->/usr/lib/x86_64-linux-gnu/libglusterfs.so.0(dict_ref+0x58) [0x7f0dbb7e4a38] ) 5-dict: dict is NULL [Invalid argument] see https://bugzilla.redhat.com/show_bug.cgi?id=1674225 - could this be related? Disabling readdir-ahead doesn't change the througput. Neither to me. BTW, read-ahead/readdir-ahead shouldn't generate traffic in the opposite direction? ( Server -> Client) (In reply to Jacob from comment #4) > i'm not able to upload in the bugzilla portal due to the size of the pcap. > You can download from here: > > https://mega.nz/#!FNY3CS6A!70RpciIzDgNWGwbvEwH-_b88t9e1QVOXyLoN09CG418 @Poornima, the following are the calls and instances from the above: 104 proc-1 (stat) 8259 proc-11 (open) 46 proc-14 (statfs) 8239 proc-15 (flush) 8 proc-18 (getxattr) 68 proc-2 (readlink) 5576 proc-27 (lookup) 8388 proc-41 (forget) Not sure if it helps. i made a tcpdump as well: tcpdump -i eth1 -s 0 -w /tmp/dirls.pcap tcp and not port 2222 tcpdump: listening on eth1, link-type EN10MB (Ethernet), capture size 262144 bytes 259699 packets captured 259800 packets received by filter 29 packets dropped by kernel The file is 1.1G big; gzipped and uploaded it: https://ufile.io/5h6i2 Hope this helps. Maybe i should add that the relevant IP addresses of the gluster servers are: 192.168.0.50, 192.168.0.51, 192.168.0.52 fyi: on a test setup (debian stretch, after upgrade 5.3 -> 5.5) i did a little test: - copied 11GB of data - via rsync: rsync --bwlimit=10000 --inplace --- bandwith limit of max. 10000 KB/s - rsync pulled data over interface eth0 - rsync stats: sent 1,484,200 bytes received 11,402,695,074 bytes 5,166,106.13 bytes/sec - so external traffic average was about 5 MByte/s - result was an internal traffic up to 350 MBit/s (> 40 MByte/s) on eth1 (LAN interface) - graphic of internal traffic: https://abload.de/img/if_eth1-internal-trafdlkcy.png - graphic of external traffic: https://abload.de/img/if_eth0-external-trafrejub.png Apologies for the delay, there have been some changes done to quick-read feature, which deals with reading the content of a file in lookup fop, if the file is smaller than 64KB. I m suspecting that with 5.3 the increase in bandwidth may be due to more number of reads of small file(generated by quick-read). Please try the following: gluster vol set <volname> quick-read off gluster vol set <volname> read-ahead off gluster vol set <volname> io-cache off And let us know if the network bandwidth consumption decreases, meanwhile i will try to reproduce the same locally. I deactivated the 3 params and did the same test again. - same rsync params: rsync --bwlimit=10000 --inplace - rsync stats: sent 1,491,733 bytes received 11,444,330,300 bytes 6,703,263.27 bytes/sec - so ~6,7 MByte/s or ~54 MBit/s in average (peak of 60 MBit/s) over external network interface - traffic graphic of the server with rsync command: https://abload.de/img/if_eth1-internal-traf4zjow.png - so server is sending with an average of ~110 MBit/s and with peak at ~125 MBit/s over LAN interface - traffic graphic of one of the replica servers (disregard first curve: is the delete of the old data): https://abload.de/img/if_enp5s0-internal-trn5k9v.png - so one of the replicas receices data with ~55 MBit/s average and peak ~62 MBit/s - as a comparison - traffic before and after changing the 3 params (rsync server, highest curve is relevant): - https://abload.de/img/if_eth1-traffic-befortvkib.png So it looks like the traffic was reduced to about a third. Is it this what you expected? If so: traffic would be still a bit higher when i compare 4.1.6 and 5.3 - here's a graphic of one client in our live system after switching from 4.1.6 (~20 MBit/s) to 5.3. (~100 MBit/s in march): https://abload.de/img/if_eth1-comparison-gly8kyx.png So if this traffic gets reduced to 1/3: traffic would be ~33 MBit/s then. Way better, i think. And could be "normal"? Thx so far :-) Awesome thank you for trying it out, i was able to reproduce this issue locally, one of the major culprit was the quick-read. The other two options had no effect in reducing the bandwidth consumption. So for now as a workaround, can disable quick-read: # gluster vol set <volname> quick-read off Quick-read alone reduced the bandwidth consumption by 70% for me. Debugging the rest 30% increase. Meanwhile, planning to make this bug a blocker for our next gulster-6 release. Will keep the bug updated with the progress. i'm running another test, just alongside... simply deleting and copying data, no big effort. Just curious :-) 2 little questions: - does disabling quick-read have any performance issues for certain setups/scenarios? - bug only blocker for v6 release? update for v5 planned? (In reply to Hubert from comment #17) > i'm running another test, just alongside... simply deleting and copying > data, no big effort. Just curious :-) I think if the volume hosts small files, then any kind of operation around these files will see increased bandwidth usage. > > 2 little questions: > > - does disabling quick-read have any performance issues for certain > setups/scenarios? Small file reads(files with size <= 64kb) will see reduced performance. Eg: web server use case. > - bug only blocker for v6 release? update for v5 planned? Yes there will be updated for v5, not sure when. The updates for major releases are made once in every 3 or 4 weeks not sure. For critical bugs the release will be made earlier. Hello guys, Thanks for your update Poornima. I was already running quick-read off here so, on my case, I noticed the traffic growing consistently after enabling it. I've made some tests on my scenario, and I wasn't able to reproduce your 70% reduction results. To me, it's near 46% of traffic reduction (from around 103 Mbps to around 55 Mbps, graph attached here: https://pasteboard.co/I68s9qE.png ) What I'm doing is just running a find . type -d on a directory with loads of directories/files. Poornima, if you don't mind to answer a question, why are we seem this traffic on the inbound of gluster servers (outbound of clients)? On my particular case, the traffic should be basically on the opposite direction I think, and I'm very curious about that. Thank you, Alberto Thank You all for the report. We have the RCA, working on the patch will be posting it shortly. The issue was with the size of the payload being sent from the client to server for operations like lookup and readdirp. Hence worakload involving lookup and readdir would consume a lot of bandwidth. REVIEW: https://review.gluster.org/22404 (client-rpc: Fix the payload being sent on the wire) posted (#1) for review on release-5 by Poornima G Unfortunately, it's blocker for us too. As Jacob, we've faced with 4x increasing outgoing traffic on clients. Disabling read-ahead and readdir-ahead didn't help. Disabling quick-read helped a little bit. Look forward to the fix and hope this bug is marked as critical so fix for the 5x branch will be released earlier. REVISION POSTED: https://review.gluster.org/22404 (client-rpc: Fix the payload being sent on the wire) posted (#2) for review on release-5 by Poornima G (In reply to Znamensky Pavel from comment #22) > Unfortunately, it's blocker for us too. As Jacob, we've faced with 4x > increasing outgoing traffic on clients. > Disabling read-ahead and readdir-ahead didn't help. Disabling quick-read > helped a little bit. > Look forward to the fix and hope this bug is marked as critical so fix for > the 5x branch will be released earlier. Will try to make a release as soon as the patch is merged. Thanks for your update. Have posted the patch, the link can be found in the previous comment. >Will try to make a release as soon as the patch is merged. Thanks for your update.
>Have posted the patch, the link can be found in the previous comment.
Thanks for the quick fix!
REVIEW: https://review.gluster.org/22404 (client-rpc: Fix the payload being sent on the wire) posted (#3) for review on release-5 by Poornima G REVIEW: https://review.gluster.org/22404 (client-rpc: Fix the payload being sent on the wire) merged (#4) on release-5 by Shyamsundar Ranganathan This bug is getting closed because a release has been made available that should address the reported issue. In case the problem is still not fixed with glusterfs-5.6, please open a new bug report. glusterfs-5.6 has been announced on the Gluster mailinglists [1], packages for several distributions should become available in the near future. Keep an eye on the Gluster Users mailinglist [2] and the update infrastructure for your distribution. [1] https://lists.gluster.org/pipermail/announce/2019-April/000123.html [2] https://www.gluster.org/pipermail/gluster-users/ Can anyone verify if the issue is not seen in 5.6 anymore? (In reply to Poornima G from comment #29) > Can anyone verify if the issue is not seen in 5.6 anymore? I'm planning to test it soon. My environment is partially in production so I need to arrange a maintenance window to do that. I will send an update here as soon as I finish. I'll so some tests probably next week, tcpdump included. Hello Poornima, I did some tests today and, in my scenario, it seems fixed. What I did this time: - Mounted the new cluster (running 5.6 version) using a client running version 5.5 - Started a find . -type d on a directory with lots of directories. - It generated an outgoing traffic (on the client) of around 40mbps [1] Then I upgraded the client to version 5.6 and re-run the tests, and had around 800kbps network traffic[2]. Really good! I've made a couple of tests more, enabling quick read[3][4]. It may have slightly increased my network traffic, but nothing really significant. [1] - https://pasteboard.co/IbVwWTP.png [2] - https://pasteboard.co/IbVxgVU.png [3] - https://pasteboard.co/IbVxuaJ.png [4] - https://pasteboard.co/IbVxCbZ.png This is my current volume info: Volume Name: volume Type: Replicate Volume ID: 1d8f7d2d-bda6-4f1c-aa10-6ad29e0b7f5e Status: Started Snapshot Count: 0 Number of Bricks: 1 x 2 = 2 Transport-type: tcp Bricks: Brick1: fs02tmp:/var/data/glusterfs/volume/brick Brick2: fs01tmp:/var/data/glusterfs/volume/brick Options Reconfigured: network.ping-timeout: 10 performance.flush-behind: on performance.write-behind-window-size: 16MB performance.cache-size: 1900MB performance.io-thread-count: 32 transport.address-family: inet nfs.disable: on performance.client-io-threads: on server.allow-insecure: on server.event-threads: 4 client.event-threads: 4 performance.readdir-ahead: off performance.read-ahead: off performance.open-behind: on performance.write-behind: off performance.stat-prefetch: off performance.quick-read: off performance.strict-o-direct: on performance.io-cache: off performance.read-after-open: yes features.cache-invalidation: on features.cache-invalidation-timeout: 600 performance.cache-invalidation: on performance.md-cache-timeout: 600 network.inode-lru-limit: 200000 Let me know if you need anything else. Cheers, Alberto Bengoa |